The Body Map
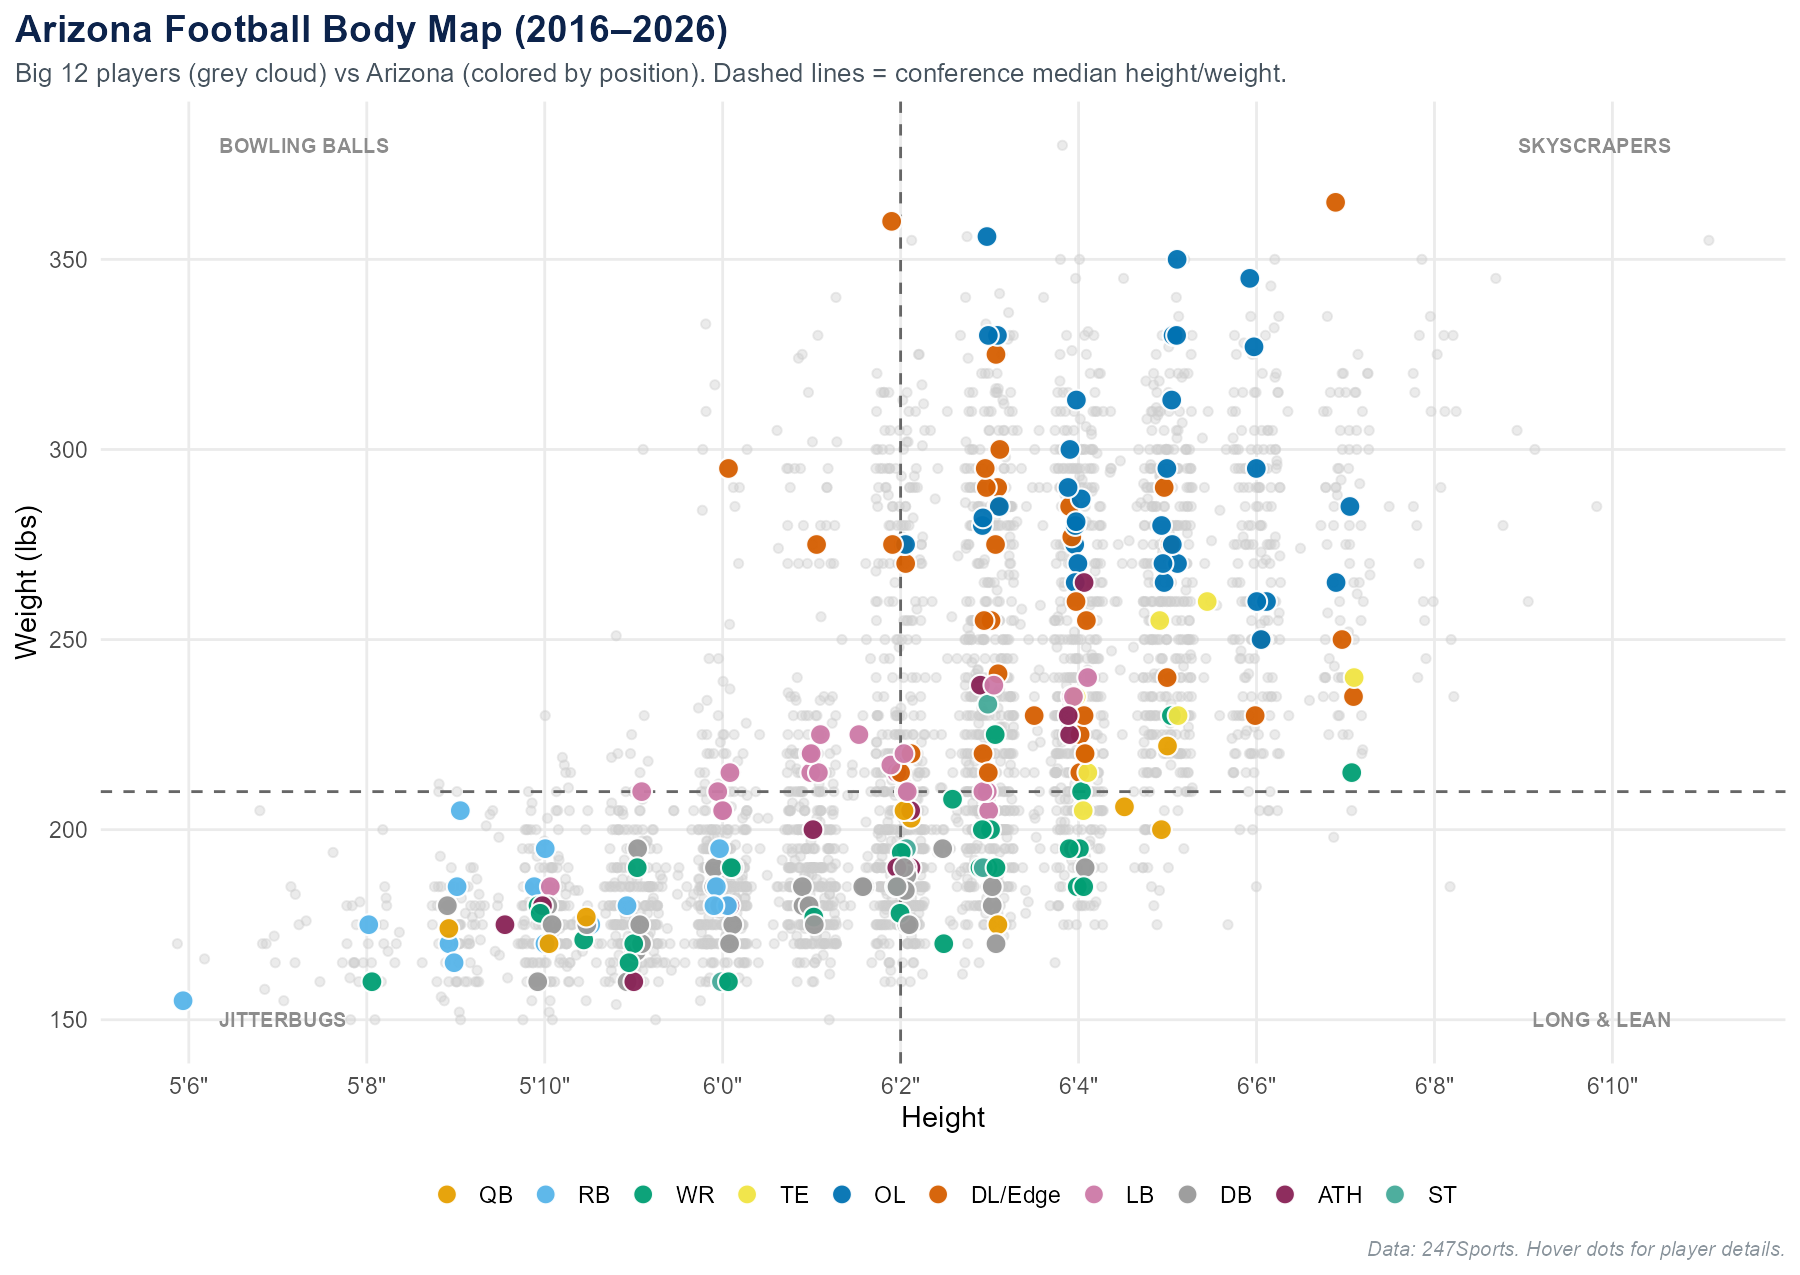
Plot height against weight across a conference, with program and position detail available on every player.
ScalePower-4 roster intelligence
The Power-4 Girth Index turns every reported inch, pound and recruiting rating into a comparative view of how 67 programs build football and basketball teams.
One control surface
Choose a program once, then move from national context to a single position room. Filters, pinned comparisons and export-ready charts stay within reach.
Plot height against weight across a conference, with program and position detail available on every player.
ScaleRank teams by weight, height and pounds per inch across full rosters or the players who define the trenches.
RankCompare recruiting rating, blue-chip share and size as full distributions across all four Power conferences.
ComparePut two programs on the same scale and inspect the physical difference by position group and class.
Match upOpen a recruit-level profile for size, rating, hometown, distance to campus and the original recruiting page.
InspectMap Arizona defenders to 3-3-5 roles, two-deep targets and incoming projected weights in one football view.
PlanJoin roster talent to season records and SP+ to find teams that develop, outperform or leave value unused.
EvaluateTrace each staff's recruiting fingerprint through ratings, blue-chip share, size and geographic footprint.
HistoryBuilt for the comparison
The interface is designed for exploration first and evidence second: isolate a question, pin the answer, then export the view with its context intact.
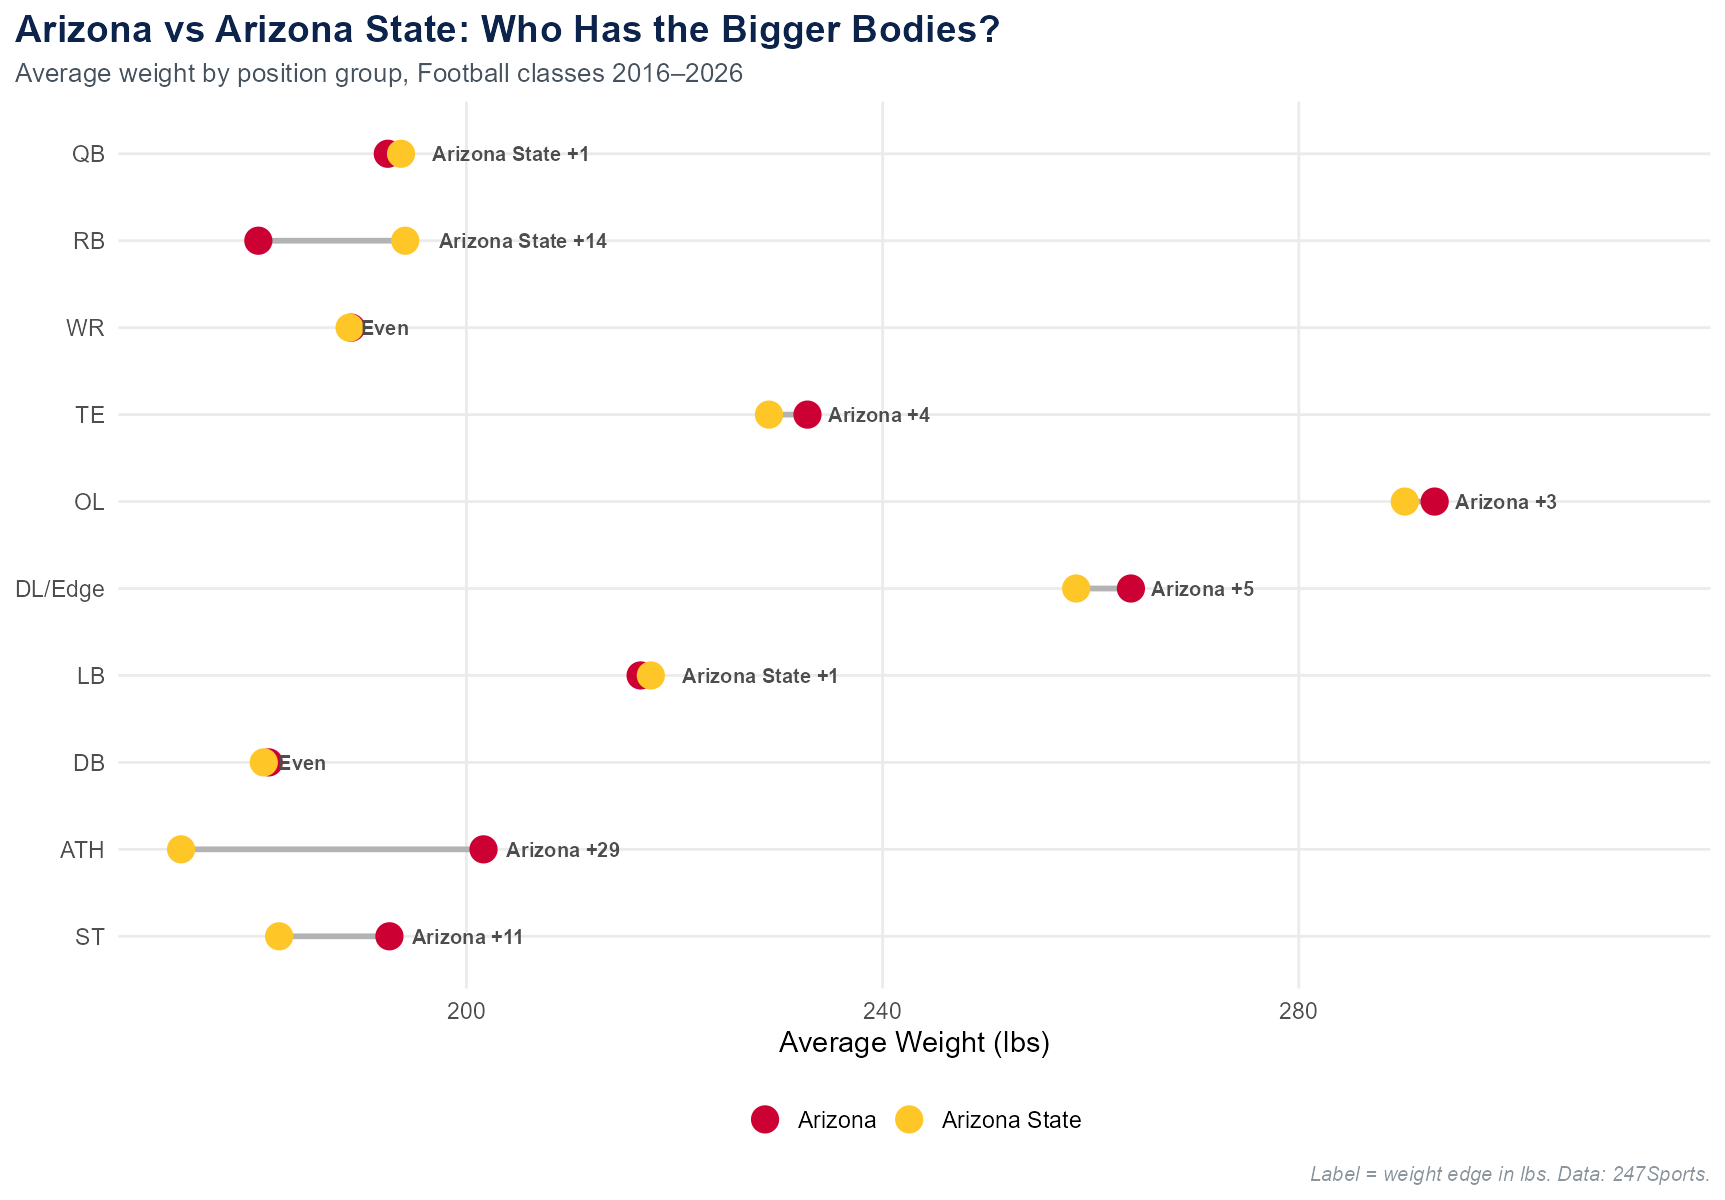
Move past roster averages. The head-to-head view reveals where one program is longer, heavier or more highly rated at the exact position groups that decide a matchup.
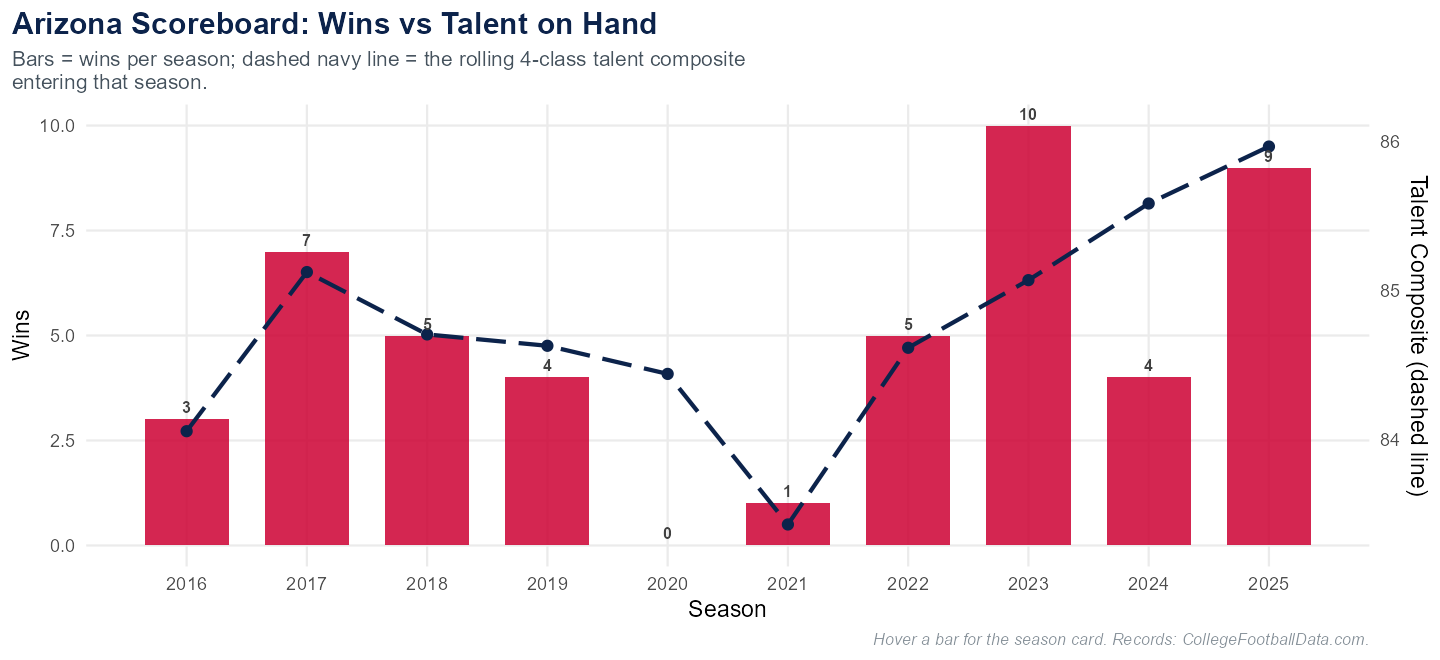
Recruiting is an input, not an outcome. The scoreboard brings composite talent, wins and SP+ together so development and underperformance are visible across seasons.
Transparent by design
Every chart names its player pool, unit of analysis and source. The app separates reported measurements from modeled comparisons and keeps the caveats beside the result.
247Sports classes and team rosters from 2016 through the current 2027 cycle, with portal additions included from 2021.
Team labels, positions, measurements and ratings are standardized so like-for-like comparisons remain possible.
Season records and SP+ from CollegeFootballData connect recruiting inputs to on-field football performance.
Program-reported heights and weights are directional, not lab measurements. Samples and definitions travel with each view.
Sources: 247Sports and CollegeFootballData. Refreshed nightly; reported data errors are reviewed at the source level.
Report an issueThe weekly Power-4 brief
New commitments, portal additions and class movement across all 67 programs, written from the nightly data with the sample behind every claim.
Desert Data Labs
The Girth Index is one example of how Desert Data Labs turns difficult data into useful, defensible tools for programs, conferences, media teams and growing businesses.